Trace AI APIs through Kong API Gateway with Langfuse
This guide demonstrates how to integrate Langfuse into your Kong API Gateway to automatically monitor, debug, and evaluate AI API calls without modifying your application code.
What is Kong API Gateway?: Kong Gateway is a cloud-native, platform-agnostic, scalable API Gateway that manages APIs and microservices. It acts as a central point of control for API traffic, providing features like authentication, rate limiting, and monitoring.
What is Langfuse?: Langfuse is an open-source observability platform for AI agents. It helps you visualize and monitor LLM calls, tool usage, cost, latency, and more.
How it works
Kong AI Gateway emits Gen AI span attributes for traffic handled by the AI Proxy plugins, and Kong's bundled OpenTelemetry plugin exports those spans over OTLP/HTTP. Langfuse accepts them directly on its OpenTelemetry endpoint, so no collector or sidecar is required.
Features
- Zero-code instrumentation: LLM traffic proxied through Kong is traced without touching your application code
- Multi-provider support: every provider handled by Kong's AI Proxy plugins, including OpenAI, Azure OpenAI, Anthropic, Cohere, Gemini, Mistral, and OpenAI-compatible upstreams such as vLLM
- Token and cost tracking: model name and input/output token counts land on the Langfuse generation, so cost is calculated for you
- Distributed tracing: W3C trace context is propagated, so gateway spans join traces from your own services
- Non-blocking export: spans are batched and exported asynchronously by Kong's queueing layer
1. Enable tracing in Kong
Prerequisites
- Kong Gateway 3.13 or later — Gen AI span attributes were introduced in 3.13
- The AI Proxy or AI Proxy Advanced plugin routing your LLM traffic
- A Langfuse account (sign up) or a self-hosted Langfuse deployment
- Access to Kong's Admin API
Kong's OpenTelemetry plugin only emits spans when tracing is enabled at the
process level. These settings cannot be applied through plugin configuration —
set them wherever Kong reads its configuration (kong.conf, KONG_*
environment variables, or your Helm values) before starting the gateway.
export KONG_TRACING_INSTRUMENTATIONS=all
export KONG_TRACING_SAMPLING_RATE=1.0
Docker Compose
services:
  kong:
    image: kong/kong-gateway:3.13
    environment:
      KONG_TRACING_INSTRUMENTATIONS: all
      KONG_TRACING_SAMPLING_RATE: "1.0"
      KONG_DATABASE: postgres
      KONG_PG_HOST: postgres
      KONG_PG_USER: kong
      KONG_PG_PASSWORD: kong
    ports:
      - "8000:8000"
      - "8001:8001"
The OpenTelemetry plugin ships with Kong Gateway, so there is nothing to install and no extra KONG_PLUGINS entry to add.
2. Configure Langfuse credentials
Get your API keys from your project settings page by signing up for a free Langfuse Cloud account or by self-hosting Langfuse. Kong authenticates against Langfuse's OTLP endpoint with Basic Auth, so encode both keys into a single header value:
export LANGFUSE_PUBLIC_KEY="pk-lf-..."
export LANGFUSE_SECRET_KEY="sk-lf-..."
export LANGFUSE_BASE_URL="https://cloud.langfuse.com" # 🇪🇺 EU region
# Other Langfuse data regions include 🇺🇸 US: https://us.cloud.langfuse.com, 🇯🇵 Japan: https://jp.cloud.langfuse.com and ⚕️ HIPAA: https://hipaa.cloud.langfuse.com

# Print the Basic Auth value to paste into the plugin configuration below
echo "$(printf "%s:%s" "$LANGFUSE_PUBLIC_KEY" "$LANGFUSE_SECRET_KEY" | base64 | tr -d '\n')"
3. Record model statistics and payloads
AI Proxy only records model statistics and request payloads when you enable them, and these are what become Gen AI span attributes. Enable both on the plugin that proxies your LLM traffic:
curl -X POST http://localhost:8001/plugins \
  -H "Content-Type: application/json" \
  -d '{
    "name": "ai-proxy",
    "config": {
      "route_type": "llm/v1/chat",
      "auth": { "header_name": "Authorization", "header_value": "Bearer $OPENAI_API_KEY" },
      "model": {
        "provider": "openai",
        "name": "gpt-4o",
        "options": { "max_tokens": 512, "temperature": 1.0 }
      },
      "logging": {
        "log_statistics": true,
        "log_payloads": true
      }
    }
}'log_statisticscaptures token usage, latency, and model metadata.log_payloadsrecords the full request prompts and model responses.
With log_payloads enabled, prompts and completions leave the gateway and are
stored in Langfuse. Review your PII and retention requirements first, and
consider data masking or a
self-hosted deployment for sensitive workloads.
4. Export Kong spans to Langfuse
Configure the OpenTelemetry plugin to send spans to Langfuse, substituting the Basic Auth value you printed in step 2:
curl -X POST http://localhost:8001/plugins \
  -H "Content-Type: application/json" \
  -d '{
    "name": "opentelemetry",
    "config": {
      "traces_endpoint": "https://cloud.langfuse.com/api/public/otel/v1/traces",
      "headers": {
        "Authorization": "Basic <LANGFUSE_BASIC_AUTH>",
        "x-langfuse-ingestion-version": "4"
      },
      "sampling_rate": 1,
      "propagation": {
        "default_format": "w3c"
      }
    }
  }'
Configuration parameters
| Parameter | Type | Kong default | Description |
|---|---|---|---|
traces_endpoint | string | - | Langfuse OTLP/HTTP traces endpoint. Required. |
headers.Authorization | string | - | Basic <base64 of pk-lf-...:sk-lf-...>. Required. |
headers.x-langfuse-ingestion-version | string | - | Set to 4 for real-time ingestion on Langfuse v4. Without it, data can appear with a delay of up to 10 minutes. |
sampling_rate | number | - | Fraction of requests to trace. Supersedes the global tracing_sampling_rate when set. |
propagation.default_format | string | w3c | Trace context format used when no tracing header is found on the incoming request. |
See Kong's OpenTelemetry plugin reference for the full schema, including resource_attributes, timeouts, and queue tuning.
For self-hosted Langfuse instances, set traces_endpoint to your instance URL
followed by /api/public/otel/v1/traces. See real-time
ingestion for details
on the x-langfuse-ingestion-version header.
5. Hello world example
Send an AI request through Kong Gateway. Kong traces it and exports the spans to Langfuse.
curl -X POST http://kong-gateway:8000/v1/chat/completions \
  -H "Content-Type: application/json" \
  -d '{
    "messages": [
      {"role": "user", "content": "Explain quantum computing"}
    ]
  }'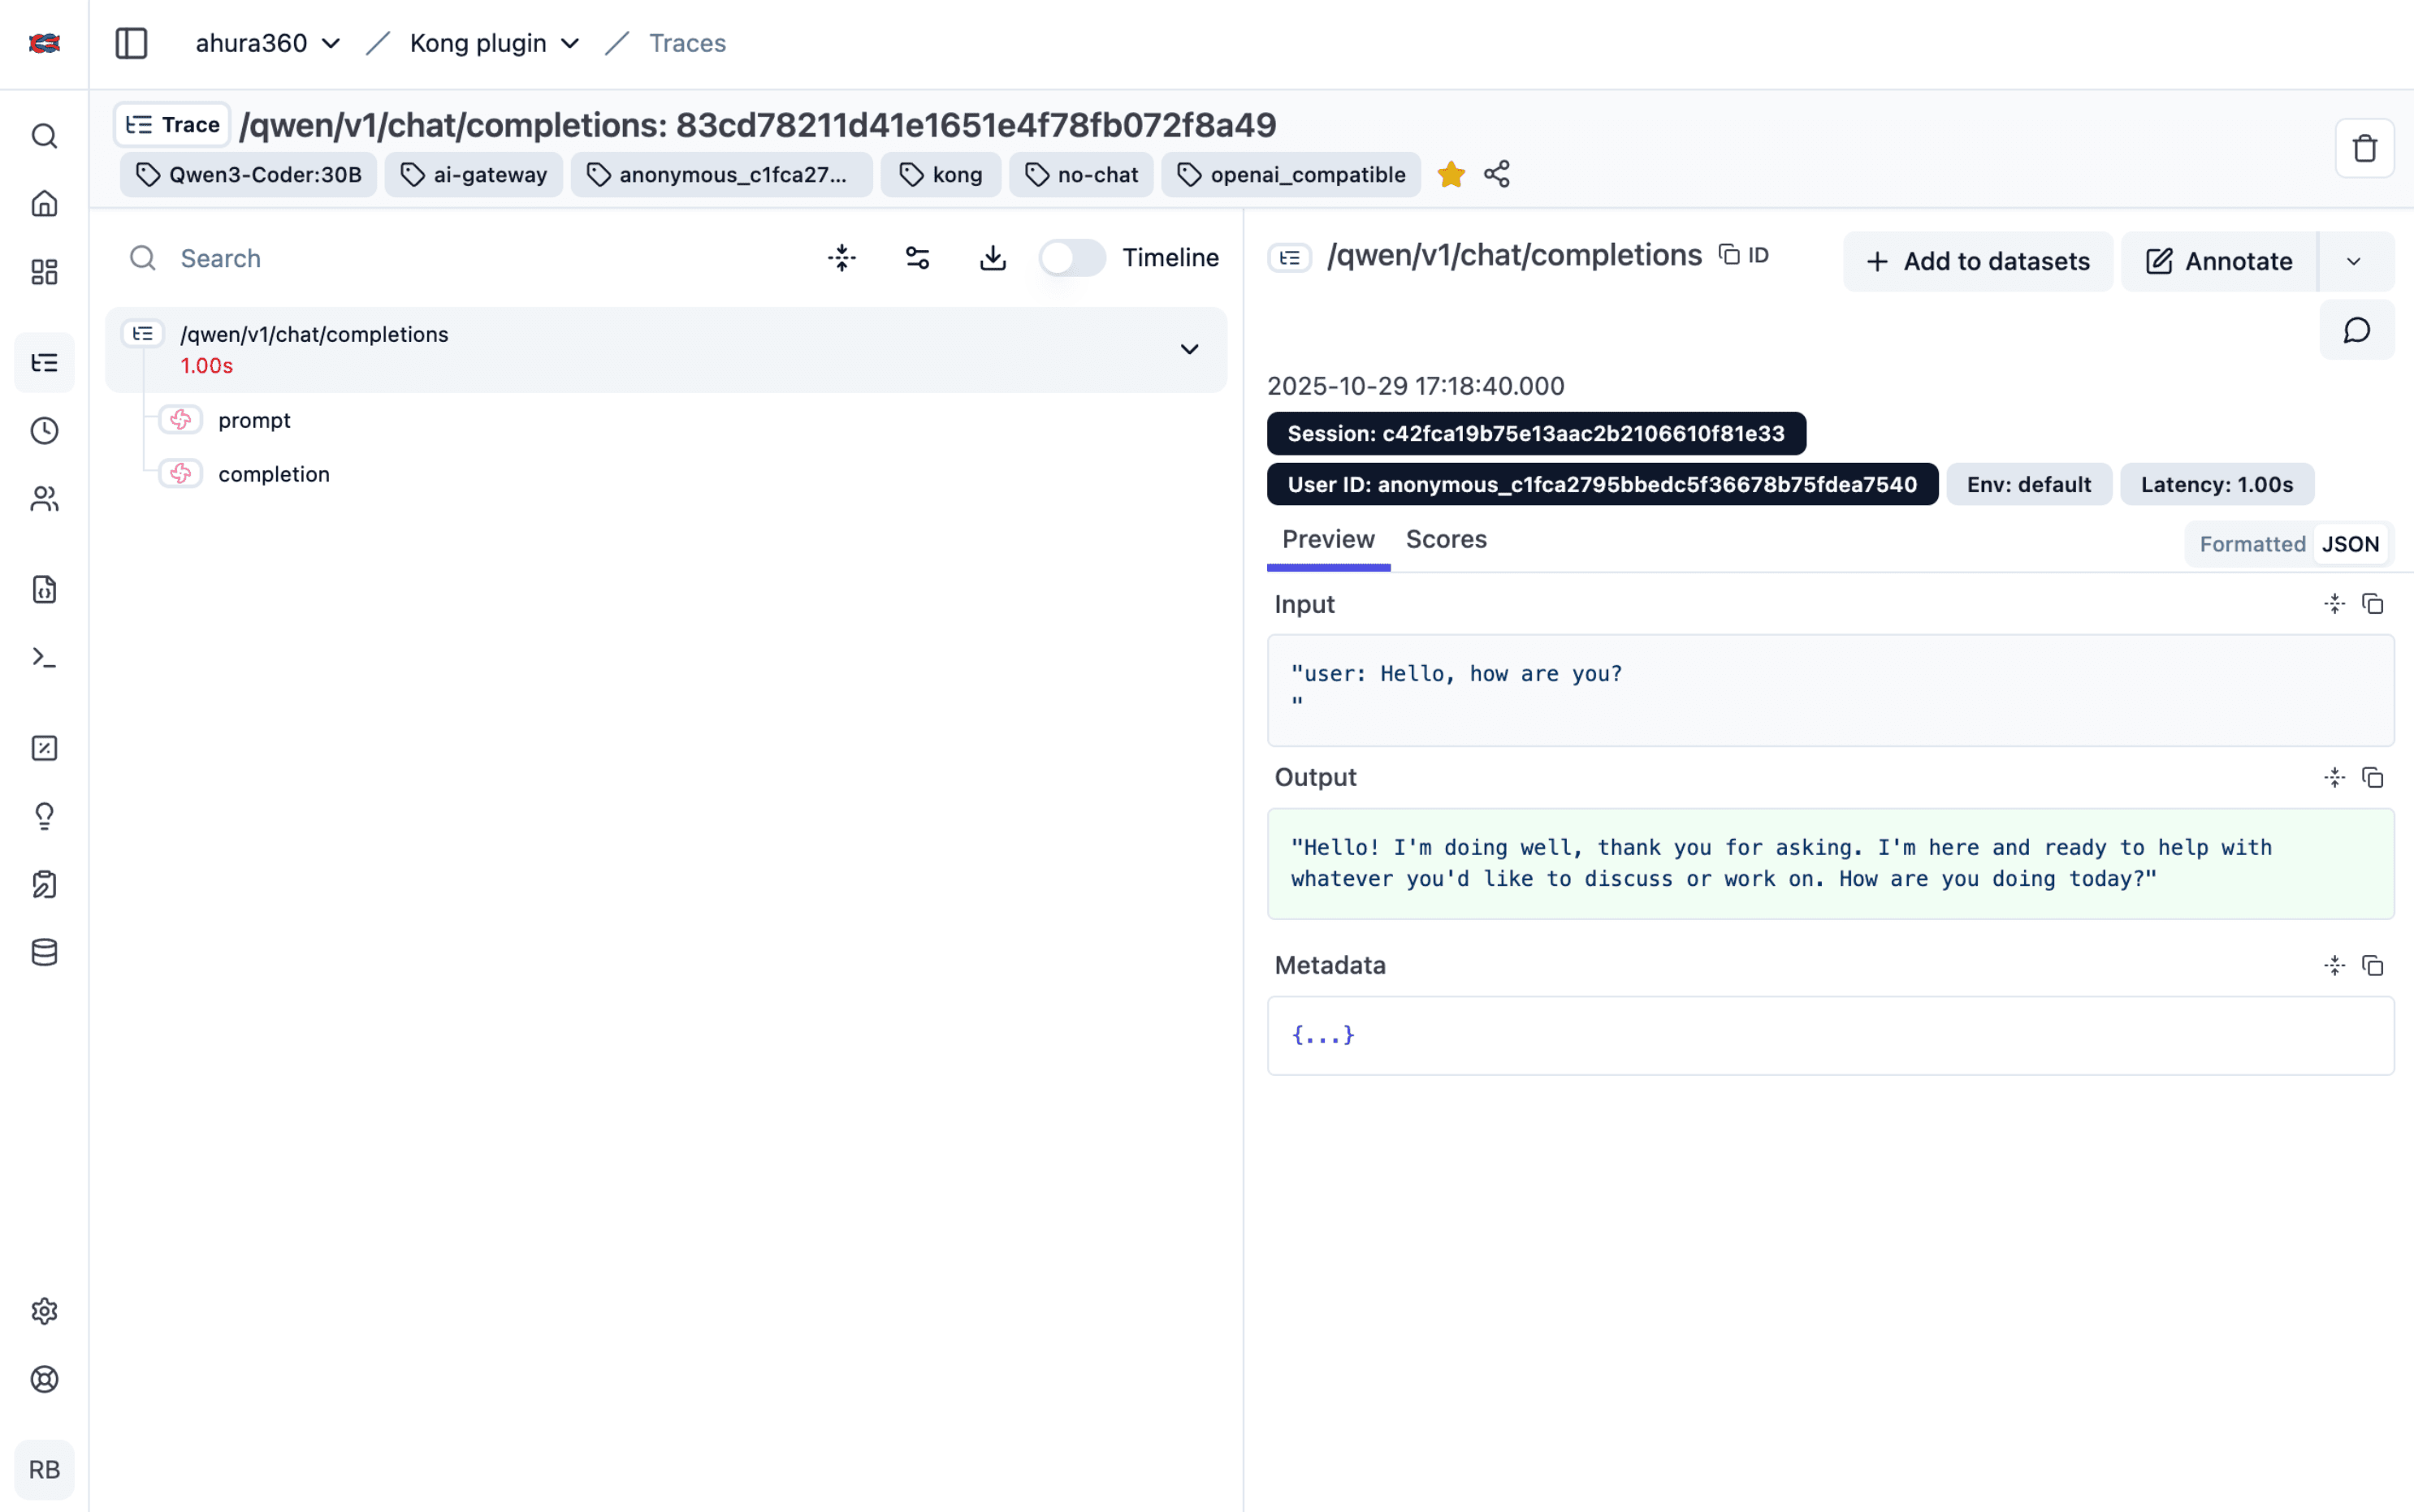
Open the trace in Langfuse to inspect the model, token usage, latency, and the prompt and response payloads.
6. Add user and session context
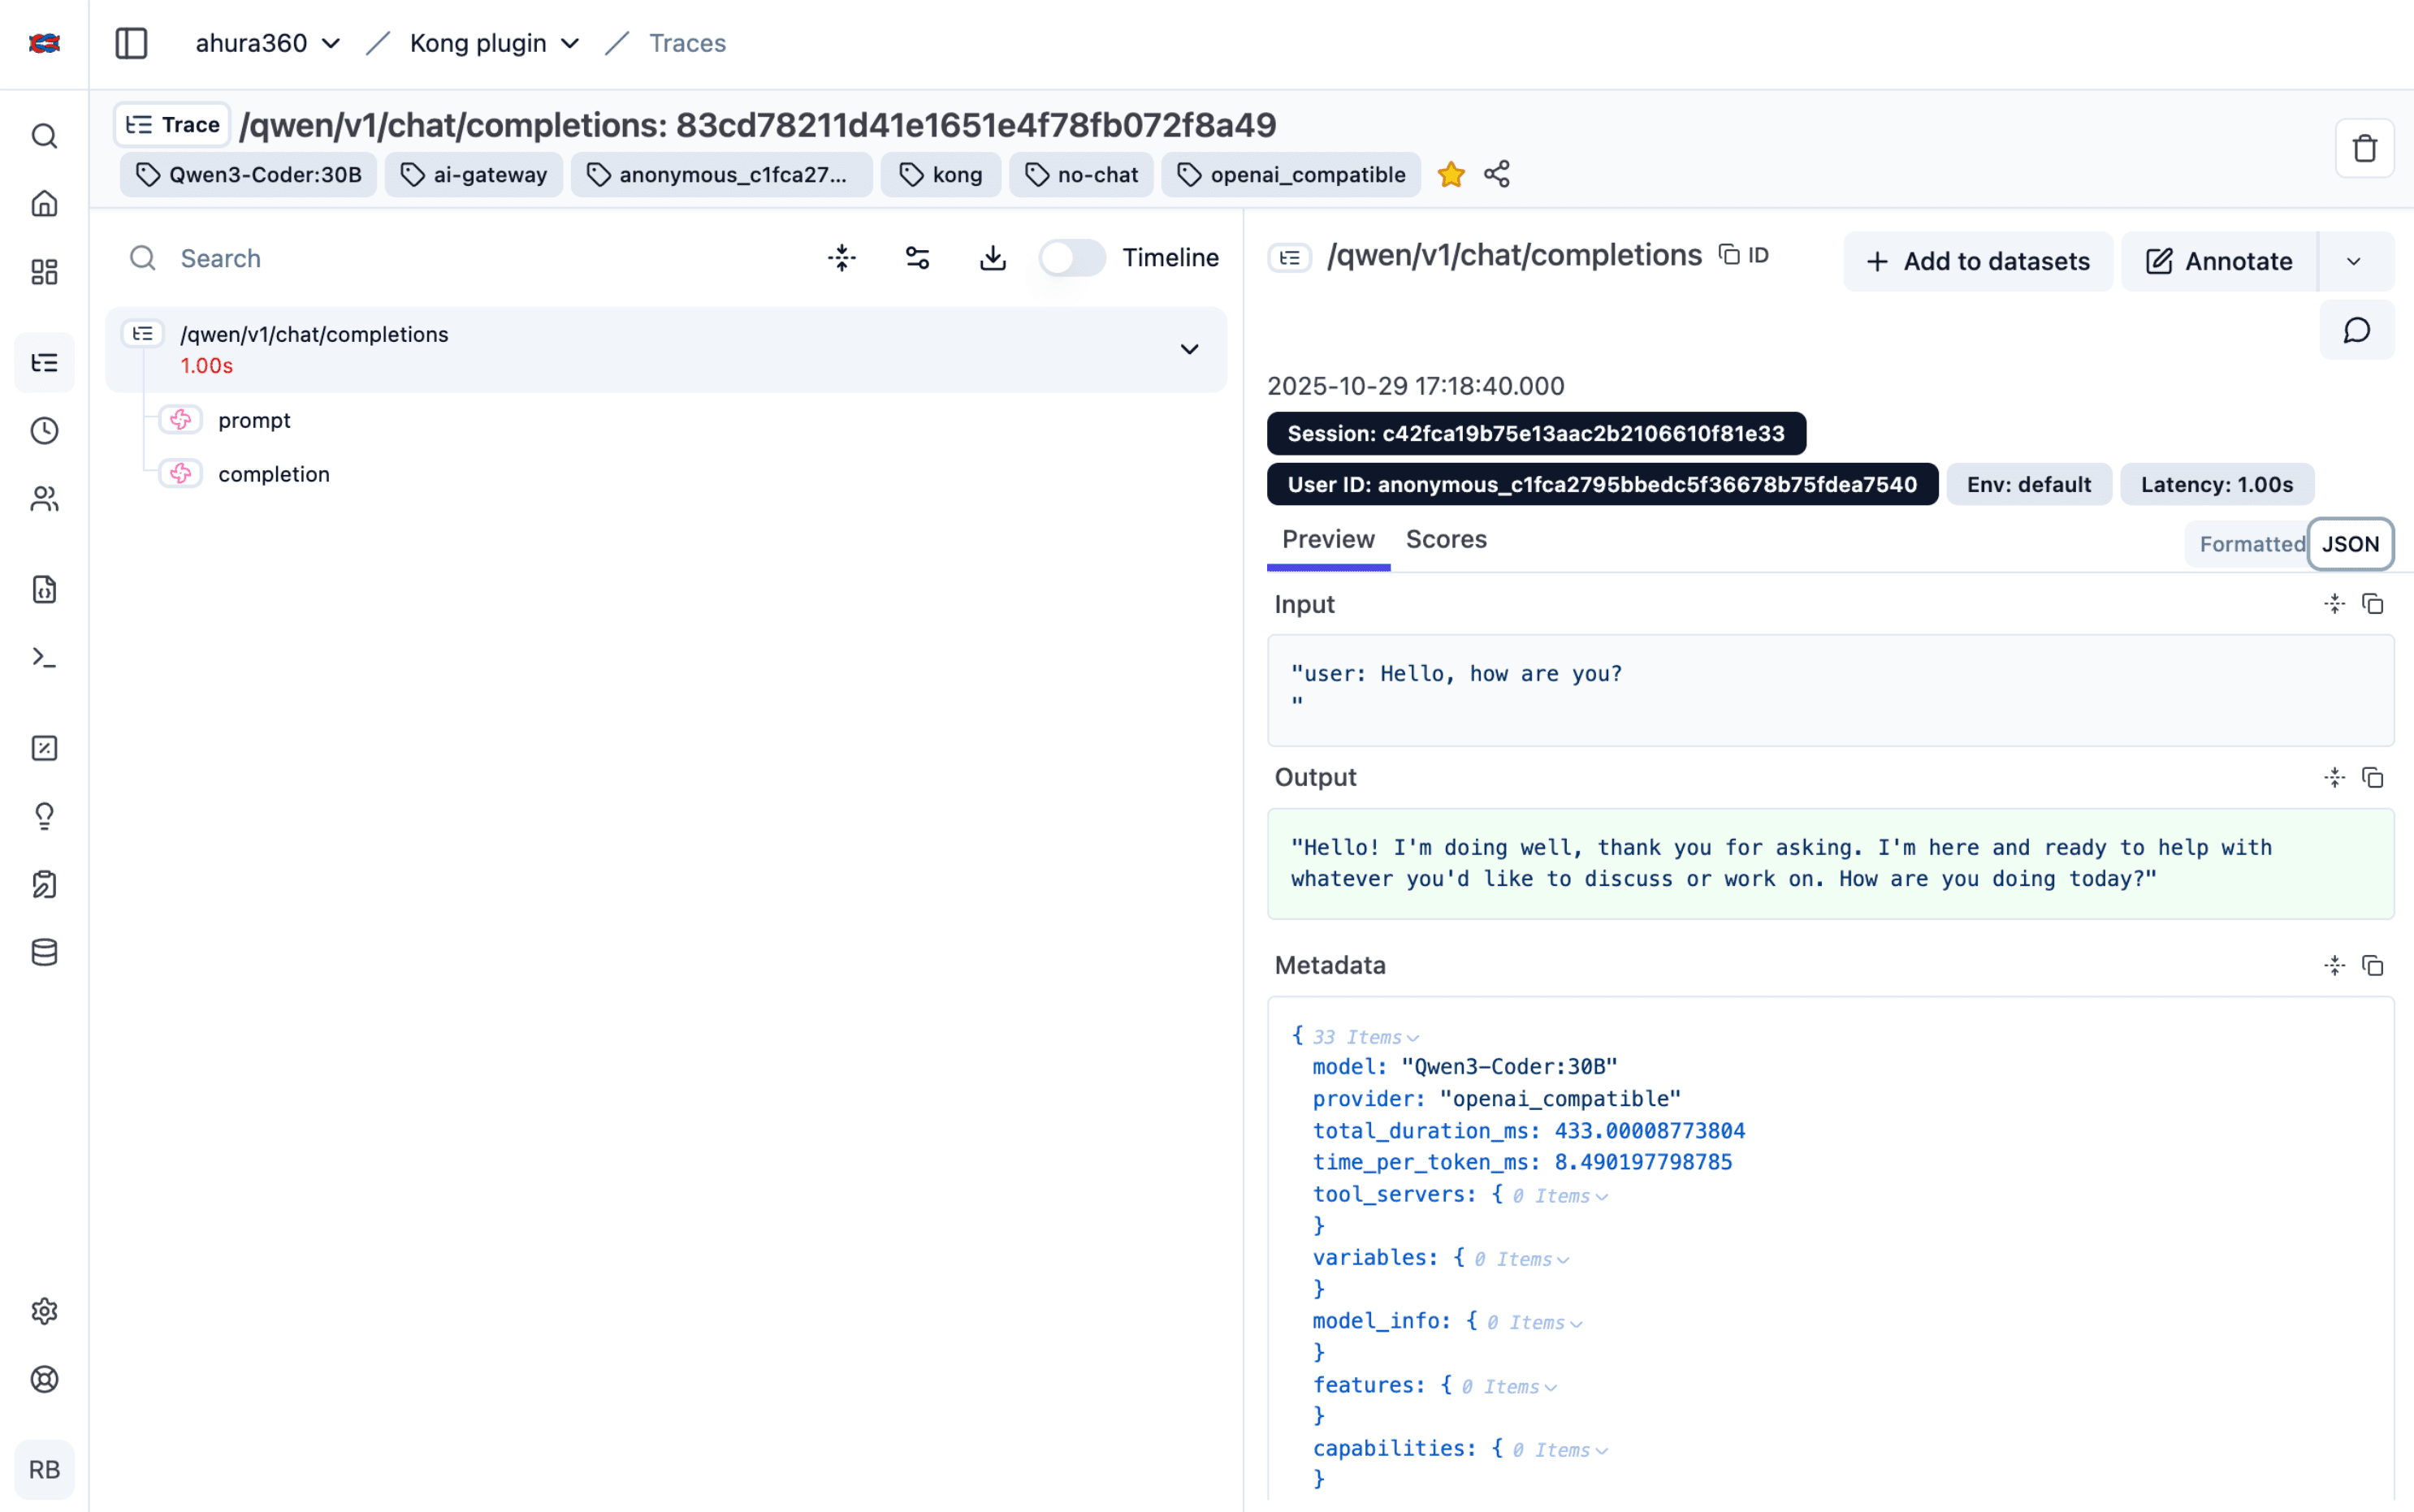
Kong does not know which end-user a proxied request belongs to, so map your own request headers onto the Langfuse trace attributes langfuse.user.id and langfuse.session.id. Kong's tracing PDK lets you set attributes on the root span from a Post-function plugin:
local root_span = kong.tracing.get_root_span()

if root_span then
  local user_id = kong.request.get_header("X-User-Id")
  local session_id = kong.request.get_header("X-Session-Id")

  if user_id then
    root_span:set_attribute("langfuse.user.id", user_id)
  end

  if session_id then
    root_span:set_attribute("langfuse.session.id", session_id)
  end
end
Apply the file to the same service or route as the OpenTelemetry plugin:
curl -X POST http://localhost:8001/plugins \
  -F "name=post-function" \
  -F "config.access[1]=@langfuse-context.lua"
Requests then carry their own context into Langfuse:
curl -X POST http://kong-gateway:8000/v1/chat/completions \
  -H "Content-Type: application/json" \
  -H "X-User-Id: user-12345" \
  -H "X-Session-Id: session-abc" \
  -d '{
    "messages": [
      {"role": "user", "content": "What is machine learning?"}
    ]
  }'
Use the same pattern for any other dimension you want to filter on in Langfuse, for example langfuse.trace.tags for tenant or feature tags. The full list of supported attributes is in the OpenTelemetry property mapping.
What Kong sends to Langfuse
Kong emits a kong.gen_ai span for each AI Proxy request, nested under the gateway's request span. Langfuse maps its attributes onto the generation:
| Kong span attribute | Langfuse field |
|---|---|
gen_ai.request.model, gen_ai.response.model | model |
gen_ai.usage.input_tokens, gen_ai.usage.output_tokens | usage, which drives cost calculation |
gen_ai.request.temperature, gen_ai.request.max_tokens | modelParameters |
gen_ai.input.messages, gen_ai.output.messages | Prompt and response payloads, present when log_payloads is enabled |
langfuse.user.id, langfuse.session.id | userId, sessionId |
Kong also emits gen_ai.operation.name, gen_ai.provider.name, gen_ai.response.id, and gen_ai.response.finish_reasons, plus dedicated spans for tool calls. See Kong's Gen AI attribute reference for the complete list and the Langfuse property mapping for which attributes are promoted to first-class Langfuse fields; anything not promoted is retained as observation metadata.
Environment-specific configuration
To keep development and production data in separate Langfuse projects, scope one OpenTelemetry plugin per Kong service and give each its own credentials:
# Development
curl -X POST http://localhost:8001/services/ai-service-dev/plugins \
  -H "Content-Type: application/json" \
  -d '{
    "name": "opentelemetry",
    "config": {
      "traces_endpoint": "https://cloud.langfuse.com/api/public/otel/v1/traces",
      "headers": {
        "Authorization": "Basic <DEV_LANGFUSE_BASIC_AUTH>",
        "x-langfuse-ingestion-version": "4"
      },
      "sampling_rate": 1
    }
  }'

# Production, sampling 10% of requests
curl -X POST http://localhost:8001/services/ai-service-prod/plugins \
  -H "Content-Type: application/json" \
  -d '{
    "name": "opentelemetry",
    "config": {
      "traces_endpoint": "https://cloud.langfuse.com/api/public/otel/v1/traces",
      "headers": {
        "Authorization": "Basic <PROD_LANGFUSE_BASIC_AUTH>",
        "x-langfuse-ingestion-version": "4"
      },
      "sampling_rate": 0.1
    }
  }'
Alternatively, keep one Langfuse project and separate the data with environments by setting the langfuse.environment attribute from the Post-function plugin shown above.
Troubleshooting
No data appearing in Langfuse
- Confirm tracing is enabled at the process level. Without
KONG_TRACING_INSTRUMENTATIONS, Kong emits no spans regardless of plugin configuration.
# Verify the plugin is attached
curl http://localhost:8001/plugins | jq '.data[] | select(.name=="opentelemetry")'

# Check Kong logs for export errors
docker compose logs kong | grep -i opentelemetry

# Confirm Kong can reach the Langfuse endpoint
curl -I https://cloud.langfuse.com/api/public/otel/v1/traces- Verify credentials. A
401in Kong's logs means the Basic Auth value is wrong; regenerate it from step 2. - Check the data region. The
traces_endpointhost must match the region your project lives in.
Missing prompts and responses
Enable logging.log_payloads on the AI Proxy plugin (step 3). Without it, Kong emits model and usage attributes but no message content.
Missing user or session context
- Confirm the Post-function plugin is scoped to the same service or route as the OpenTelemetry plugin.
- Check header names match exactly (
X-User-Id, notX-UserId), and that upstream proxies forward them.
Export timeouts under load
Tune the plugin's connect_timeout, send_timeout, and queue settings, and lower sampling_rate for high-volume services. See Kong's plugin reference.
Enable debug logging
export KONG_LOG_LEVEL=debugSecurity best practices:
- Store Langfuse API keys in Kong's vault rather than in plaintext plugin configuration
- Review exported payloads for PII compliance before enabling
log_payloads - Restrict access to plugin configuration in production
- Ensure Kong-to-Langfuse communication uses HTTPS
- Configure data retention for sensitive content
Alternative: community Langfuse tracing plugin
A community-maintained Kong plugin, kong-langfuse-tracing by Ramtin Boreili, writes traces to Langfuse directly instead of going through OpenTelemetry. It adds provider detection for non-AI-Proxy routes and maps request headers to Langfuse fields without custom Lua.
The plugin posts to /api/public/ingestion, which is
deprecated in favor of OTLP
ingestion. It continues to work, but data ingested this way can appear with a
delay of up to 10 minutes on Langfuse v4. Prefer the OpenTelemetry setup above
for new deployments.
Resources
- Kong Gen AI OpenTelemetry attributes
- Kong OpenTelemetry plugin
- Kong Gateway tracing guide
- Langfuse OpenTelemetry integration
Last edited


